Your order book is leaking.
Churn detection·Chargeback recovery·Style momentum·Dead stock·Size curve·PO timing·Rep briefs·Account scoring·Pipeline visibility·Board reporting
All of it. One approval away.
The signal is invisible from inside a single brand. We see it across all of them.
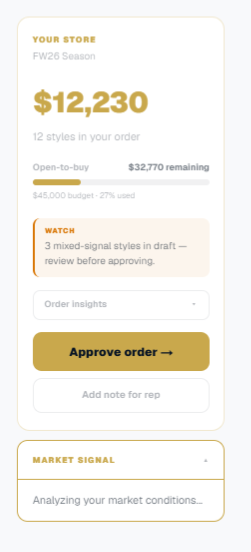
Belmont Fifth Avenue
3 chargebacks · $8,900 at risk
Dispute window closes in 11 days. Letter drafted. Not sent.
11 DAYS
window closing
Wholesale brands run on six systems.
Built separately. Sold separately. None of them connected.
PNSIQ solves this by reading all six. At the same time.
The state of wholesale apparel · 2026
$70B–$140B
in overproduction sits in wholesale pipelines every year
McKinsey and the Ellen MacArthur Foundation estimate the fashion industry produces 2.5 to 5 billion excess items annually. The brands holding that stock are paying to warehouse, discount, and eventually destroy it.
McKinsey State of Fashion 2025
233%
increase in retail chargebacks in 2025 alone
Clothing and accessories are now the single most disputed category. More than digital subscriptions, more than home goods. Retailer deduction teams are growing. Most brand AR teams are not.
Payscout Industry Report 2025
70%
of a sales rep's week is spent on work that is not selling
Salesforce found that only 28 to 30 percent of rep time goes to actual selling activity. The rest is admin, data entry, internal meetings, and prep. Most of which could be eliminated if the data were already read and the brief already written.
Salesforce State of Sales 2025
35%
of fashion executives are actually using AI in wholesale operations
75 percent say it is a priority. 35 percent are using it. The gap is not ambition. Every AI tool they have tried operates on one data source at a time. Chargebacks in one system. Accounts in another. Inventory in a third. Nothing connects them.
McKinsey / BoF State of Fashion 2026
The CFO's view
The average wholesale apparel brand collects 88–91 cents for every dollar it invoices. The rest disappears into retailer deductions, contested chargebacks, and adjustments that never get disputed. Most CFOs track this gap in a spreadsheet — if they track it at all.
lost per dollar invoiced
on average, across wholesale apparel
PNSIQ shows you exactly where it went — and drafts the action that gets it back.
No ERP shows you this view
Odoo, NetSuite, Shopify B2B, NuOrder — none of them reconcile gross invoiced against net collected month by month and tell you what happened in between. That reconciliation lives in a finance analyst's spreadsheet, updated quarterly, reviewed never.
The gap compounds silently
A 9-cent loss rate on $50M in annual wholesale is $4.5M leaving your business every year. Without a line item. Without a report. Without anyone responsible for closing it. The gap was always there — it just wasn't visible in one place.
Recovering it is 100% margin
Chargebacks recovered carry no cost of goods, no commission, no fulfilment cost. Every dollar that comes back is a dollar of pure margin. A brand that recovers $500k in chargebacks this quarter did not sell more — they kept more of what they already shipped.
True Revenue View
12 months of gross vs. net, month by month.
The patterns that cost you money — and the actions that close them.
No spreadsheet.
No analyst.
No lag.
The buyer behind your revenue
Loss aversion
The pain of a markdown is twice as sharp as the pleasure of a sell-through. This is measurable and documented. Buyers feel it in every appointment. So they protect themselves. They commit less than their open-to-buy allows, skip styles they are unsure about, and reorder only what already worked.
The rep dynamic
Buyers suspect the rep is pushing inventory. Reps know the buyer is skeptical. That adversarial default compresses every sale before a single style is discussed. Every dollar left on the table is not a budget problem. It is a confidence problem.
What they say, in their words
I'm staring at 200 styles and I have to pick 30. I don't know which will sell in MY store.
My rep keeps pushing this style. Is it because it's trending? Or because they have inventory to move?
Last season I over-ordered XS. Do I cut it in half this season, or was that just a weird quarter?
I have $80k open-to-buy left. Will I hit my margin target if I commit this much to one brand?
When those questions have answers, the sale stops being adversarial. The buyer stops hedging. The order moves.
0–30%
order size increase when buyers have data behind their decision instead of instinct
0×
how much more painful a markdown feels than a sell-through feels rewarding. This is why buyers undercommit every season.
0%
increase in order value when buyers receive a structured recommendation at the moment of decision
The gap
The problem
What we built
Chargeback disputes required a human. One letter at a time. Against a window most brands missed.
We read the deduction, pull the evidence, match the retailer format, and draft the letter.
Fewer than 30% of deductions were ever contested. Not because they were invalid. Because one AR team working a manual queue could not get to all of them before the 30 to 60 day window closed.
Every chargeback gets a response. Every window stays open. The work that required a person and a day now happens before anyone asks.
The size curve data existed. Nobody had time to find it at the appointment.
We read the account's full size history and calculate the correction before the appointment starts.
Three years of sell-through by size, by account, by style. Sitting in the ERP. At the appointment the buyer had a linesheet and their memory. The data that would have corrected the order was in a system nobody opened.
Recommended ratio, projected margin impact, last season's error. All of it in the room before a single style is discussed. The data that existed for years finally reaches the decision.
Dead stock was discovered by whoever noticed. Usually month four.
We monitor sell-through continuously and flag the style at week four.
By then outlet markdown was the only option. Less than 50 cents on the dollar. Not because that was the best recovery. Because it was the only one left by the time anyone looked.
Hold vs markdown vs liquidation network, compared with cash math automatically. The recovery window that used to close stays open. The best option is still available.
Why this is different
Descriptive analytics
what happened
Predictive analytics
what will happen
Prescriptive analytics
what to do about it
Decision Intelligence
PNSIQ
Every BI tool, every AI platform, and every wholesale software on the market stops at predictive. They surface the insight. The human still decides what to do, drafts the action, and executes it.
Decision Intelligence is the discipline that says the system's job is not finished until the decision is made. Before a single output reaches your team, our technology has processed the full dataset, run the simulations, calculated the probability of every outcome, and compressed that analysis into the one action with the highest probability of working at the moment it can still work.
The patterns in your order book are not unique to you. They are predictable across every brand in the market. You cannot see them from inside your own data. We can.
Six pattern engines
Each ends in a drafted action.
The accounts drifting toward silence before anyone notices.
Output: Drafted retention email per at-risk account. Rep's name on it. One tap to send.
90 days
before permanent silence. This is the window.
The deductions your AR team hasn't disputed yet.
Output: Dispute letter per chargeback: evidence pulled, retailer portal format, confidence score. Approve and submit.
30–60 days
dispute window · after that it writes off permanently
The rising styles your reps haven't put in front of the right accounts yet.
Output: Per-rep appointment brief: "Your top 10 accounts haven't bought Style 4029. Here's why they should."
+20%
average revenue lift when cross-sell styles surfaced at appointment. McKinsey.
The inventory losing recovery value every week it sits.
Output: Markdown proposal per SKU: discount, timing, projected lift. Push-to-outlet vs hold comparison with cash math.
+119%
recovery lift via network matching vs default markdown
The size ratios about to repeat last season's mistake.
Output: "Last order 2-2-2-1 yielded 22% markdown on L. Recommended: 2-3-3-2 for +$14k projected margin."
+$14k
projected margin per corrected account per season
The POs that will miss the retailer's OTB window.
Output: Risk flag per PO: expedite, split shipment, or renegotiate delivery. Before the goods ship.
30%
of wholesale POs miss the retailer's OTB window. Each one triggers a chargeback or forced markdown.
For the CEO
Hear what PNSIQ does
Revenue leaves your business through gaps your P&L won't show you until next quarter.
The deductions taken. The inventory aging past its recovery value. The accounts that went quiet six weeks ago. Every one had a window. Every window had a deadline. We surface every recoverable dollar before it closes — not after.
$3.8M
recoverable surfaced
Per portfolio review.
100%
of windows caught
Before they close.
0
Thursday surprises
Every brand briefed Monday.
Portfolio Command Center
All Brands · Live View
5 brands · $185M portfolio
Portfolio Revenue
$185M
At-Risk Revenue
$4.8M
CB Exposure
$984k
Brand Health
3G · 1A · 1R
Portfolio Health
3 Healthy
1 Watch
1 Critical
WILLIAM SPRINGS APPAREL
$48.3M TTM
YoY
+9%
At-Risk
2 accts
CB Open
$183k
Recovery
All clear
Atelier Poppy
$22.1M TTM
YoY
−2%
At-Risk
6 accts
CB Open
$340k
Recovery
3 drafts pending
Garrison Tweed
$14.8M TTM
YoY
−14%
At-Risk
12 accts
CB Open
$461k
Recovery
Action required
Total recoverable opportunity
$3.8M
Chargebacks
$984k
Dead Stock
$2.2M
Size Lift
$614k
Portfolio health
William Springs
Healthy
Atelier Poppy
Watch
Garrison Tweed
Action required
Green, amber, red per brand. At a glance.
Total exposure
At-risk revenue
$4.8M
Chargeback exposure
$984k
Dead stock value
$2.2M
At-risk revenue, chargeback exposure, dead stock. Across all labels.
Actions waiting
Dispute letters
3
Re-engagement emails
4
Markdown proposals
2
Every draft already written. One signature each.
The buyer surface
When your buyer logs in, the order is already built. Their job is to remove what doesn't fit. Not build what might. Size ratios corrected from last season's data. Every style comes with a reason and a projected sell-through.
Size curve corrected
Last season's sell-through data applied before they open the order. Sizes land closer to the floor.
Upsells surfaced
Styles that pair together across similar accounts are flagged. Buyer sees the full picture, not just the linesheet.
Live order signals
As the buyer adjusts quantities, the order updates in real time — sell-through projection, OTB status, concentration warnings.
15–30%
order size increase per buyer
30 min
to approve vs 4 hrs to build from scratch
avg 82%
projected sell-through on recommended styles
Why this works
4–8×
Default effect
Defaults are accepted at 4 to 8 times the rate of opt-in choices. The pre-built order is the default. Buyers accept, not construct.
Johnson & Goldstein, Science 2003
2×
Loss aversion
Losses feel twice as painful as equivalent gains feel good. Removing a style from a full order hurts. Buyers remove less than they would have added from zero.
Kahneman & Tversky, Prospect Theory 1979
→ 0%
Decision fatigue
After reviewing hundreds of options, decision quality collapses. A pre-built order bypasses the depleted state. The buyer approves instead of agonizes.
Baumeister 1998 · Danziger et al., PNAS 2011
For sales reps
Salesforce studied 7,700 reps: sales activity is 30% of the week. We eliminate the prep entirely. Every account arrives pre-classified: portal activity, sell-through trends, order cadence, silence duration. The rep walks in knowing what state the buyer is in and what to lead with.
70%
of rep time is non-selling
Salesforce State of Sales 2025
34.7%
annual rep turnover from burnout
Bridge Group
+28%
win rate lift with structured pre-call prep vs ad-hoc
CSO Insights Sales Performance Report
Sell-through up. Portal active. Recent orders performing.
Send the rep now. Present the new linesheet. This is the window.
Tough season. Sell-through below baseline. Buyer hesitant.
Lead with the size curve correction. Confidence before volume.
Metrics declining. Engagement dropping. 30–60 days before silence.
The rep who walks in now changes the outcome. Wait and the account is gone.
Ordered but not reordered. Still clearing last season.
Re-engagement timed to their clearance cycle. Push before they're ready and you lose them.
90+ days silent. Re-engagement probability near zero.
One action. Now. The window closes permanently after this.
The rep's toolkit
Every rep walks in with a live account brief. Sell-through by style. Open chargebacks. Order cadence. Silence duration. Generated on the account before the appointment. Nothing to prepare. Everything already known.
Reps guessing which styles to push at each account. Instinct, not data.
Every account's buying pattern is read. Your rep walks in knowing which styles belong there and why.
Reps spend 65% of their time on non-selling activity. The signal was in the data the whole time. Salesforce State of Sales.
Twenty minutes of manual prep per call. Notes scattered across email, CRM, and memory.
The brief is ready before the rep leaves. Sell-through by style. Open chargebacks. Order cadence. Days since last contact. Everything in one read.
Structured pre-call intelligence improves appointment outcomes by 31%. Aberdeen Group.
Finding out an account was gone when they didn't show at the next market.
The flag comes at day 30. Re-engagement email is already drafted. The window is still open.
68% of accounts that reach 90 days silent never reorder. Retaining one costs 5x less than replacing it. Bain and Company.
Reps working the list top to bottom. Same schedule every week regardless of where each buyer actually is.
Each account's urgency is scored daily. Your action queue puts the right account at the top at the right moment.
Timing outreach to the buyer's natural purchase cycle increases close rate by 29%. Forrester.
Assuming a quiet account is a loyal one. Finding out they moved their budget at the next market.
When an account's buying pattern shifts in a category, the signal shows before the season ends.
73% of B2B buyers evaluate alternatives in every category before committing. Forrester.
End of quarter surprises. Accounts that looked fine that weren't. Opportunities that closed before anyone flagged them.
Every account enters the quarter scored, classified, and with a recommended first action. No surprises at the close.
Reps with structured account scoring outperform unscripted reps by 20 to 30% on close rate. Harvard Business Review.
Revenue exposure · $500M wholesale brand
recoverable per year
Not to competition. Not to market conditions. To decisions that had better data.
Integrations
Every brand already exports AR aging, order history, and inventory. Send us those files. We read them and the engines start immediately. No IT project. No rip-and-replace. Direct API connections built as you scale.
Scale
$47M wholesale · 312 accounts · 22 reps
FW25 · 6-month verified results
$397K
Hard-recovered
Chargebacks + dead stock
$1.4M
Pipeline reopened
From 29 silent accounts
31
Disputes filed & won
Previously: 0 per season
11 days
Avg dead stock to deal
vs. weeks to markdown
Chargeback recovery
$214,000
$0
Recovered prior season
31 disputes filed inside the retailer window. 28 approved. Every window was previously missed — the AR team was always on something else when the 30-day clock ran out.
Dead stock — above markdown
+$183,000
31¢
Markdown default recovery
4 aged SKUs matched to the cross-brand liquidation network at 67% average recovery. 847 units closed in an average of 11 days from flag to signed deal.
Silent accounts reopened
$1.4M
90+ days
Avg silence before permanent loss
41 accounts flagged between day 60 and 75 of silence. 29 re-engaged before the permanent loss window closed. 12 placed orders within 30 days of the first outreach.
“We knew we were losing chargebacks. We didn't know it was $214,000 in a single season. The dispute letters were drafted and sitting in a queue before we even looked at the portal.”
Marcus Reed
VP Sales
Total 6-month impact
$397K
hard-recovered
$1.4M
pipeline reopened
Results represent outcomes from a single brand over one FW season. Actual recovery varies by dispute window, account data completeness, and inventory position. Chargeback approval rates depend on retailer and claim type.
Recovery calculator
See what PNSIQ recovers on a book your size.
Every dollar identified has an output already drafted. Not a projection. A recovery.
Confirmed recoverable this year
Based on auditable loss categories present in every wholesale order book. Each dollar identified corresponds to a specific recovery output. Actual amounts vary by account data, dispute window, and inventory position.
Chargebacks
Retailers operate entire deduction departments.
$400K – $800K
per year
Dead Stock
Seasonal buying creates overstock structurally.
$600K – $1.0M
per year
Silent Accounts
Buyers change jobs.
$400K – $800K
per year
Size Curve
Buyers order size ratios by feel.
$200K – $400K
per year
PO Timing
Production delays happen.
$200K – $600K
per year
Get in touch
The margin loss is already in your numbers. The recovery window is not.
